Estonia is still voting on paper. Most votes cast on election day on paper (blue). Share of i-votes(red) has risen but participation has stayed the same. Early voting has risen but i-votes are given 2 times less than on paper(per hour).
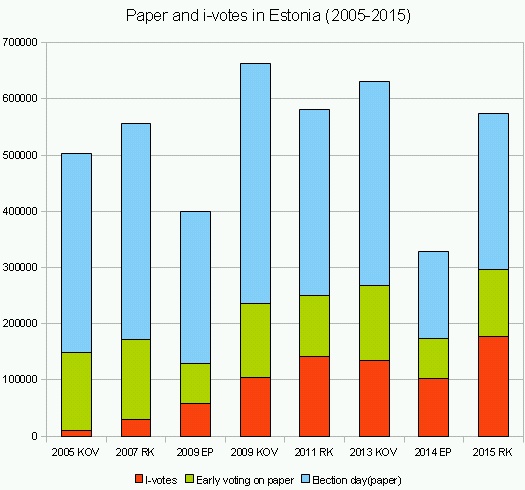 I-voting in Estonia. Most votes are given on paper and on election day. KOV – local election, RK – parliamentary election, EP – European parliament election. Graph: Virgo Kruve
I-voting is only possible during early voting(7 days, 153 hours). Last i-vote is counted and if there is cast paper vote(during early voting period), it will be canceled. On voting day e-voting is not possible.
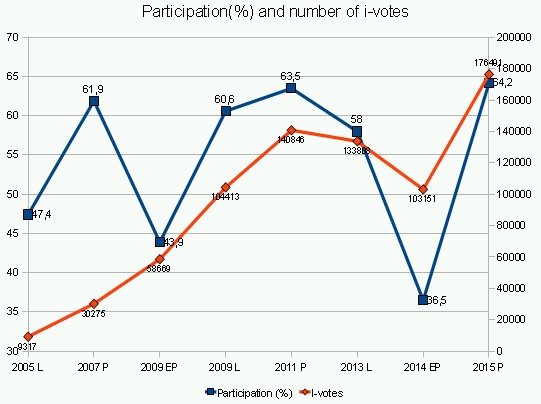 i-voting has not increased voter turnout or participation(blue). Number of i-votes(red) has increased but participation stayed the same. L – local election, P – parliamentary election, EP – European parliament election. Graph Virgo Kruve
Local election – during 2 last election i-votes have increased up to 133808 but participation fell 4,3%(change 2,6 points) from 60,6 to 58.
Participation (%) I-votes
2005 L 47,4% 9317
2009 L 60,6% 104413
2013 L 58% 133808
Parliamentary elections. There is no link between i-voting and participation.
Participation (%) I-votes
2007 P 61,9% 30275
2011 P 63,5% 140846
2015 P 64,2% 176491
European Parliament elections. Number of i-votes almost doubled but participation fell 16,8%(7,4 points) from 43,9% to 36,5%.
Participation (%) I-votes
2009 EP 43,9 58669
2014 EP 36,5 103151